


A more thoughtful way to manage your stockyard.
Beyond dashboards and spreadsheets, this is a spatial interface for clarity, control, and confidence.
Sentient’s StockyardViz binds your real-time data to a precise 3D model of your stockyard infrastructure, all within a single highly interactive digital twin.
Operators, planners and management alike can interact with StockyardViz to make better informed, more contextual and faster decisions delivering a safer more compliant work environment to everyone involved.
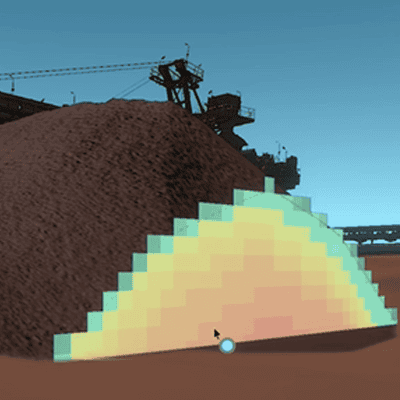
Choose an axis and explore your stockpile from any angle in precise, 3D detail.
Slide to reveal cross-section →
The Stockyard Visualisation is running on the giant screens at the front of the control room, and it is surprising how many times that I look at it each day. I'm working with the scheduling team and we use it as a reference to check that the next train loading, dumping, and ship loading tasks are aligned with stockyard visualisation, and that the stackers and reclaimers are where we expect them to be.Production Specialist
- Integrated Systems
If I misread what’s in the yard, we’re risking non-compliance or poor blend quality. And that doesn’t just impact production — it affects people, performance, and planning.Elise
- Stockyard Planner
This is particularly useful for understanding how material layered during stacking and predicting what a reclaimer will encounter as it cuts through the pile.
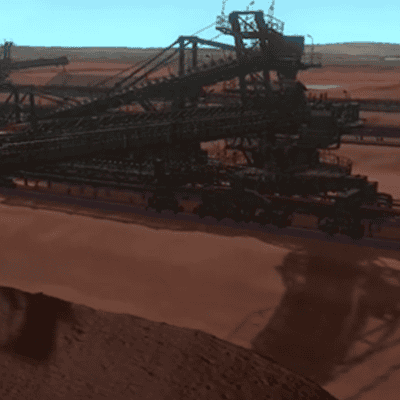
Position data updates in real-time, so you always know exactly where your machines are and what they’re doing.
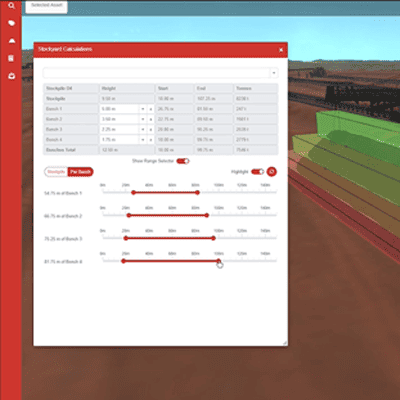
You can visualise how different reclaim scenarios would affect your blend outcome, giving you control and certainty over whether your final product will meet specification — before material leaves the stockyard.
You can test different approaches — such as alternative reclaim paths or stacking sequences — and see the predicted outcomes before executing them in the real world.
Stockpile layering — Material stacked over days or weeks creates 100+ thin layers of varying grade
Sequential reclaiming — The reclaimer cuts through those layers in sequence, not all at once
Stacking-reclaiming direction — Reclaiming parallel to stacking direction causes layer segregation; perpendicular reclaim improves blending
Lab delay — Assay results arrive 6-8 hours after stacking, so decisions are often made on outdated information
The common thread is lack of visibility into what’s actually inside the pile.
You can simulate different reclaim paths and predict what grade each ship hatch will receive. If a hatch is trending toward spec limits, you can adjust the plan proactively — before it becomes a customer conversation or penalty event.
When Hatch 1 runs high and Hatch 5 runs low, even if the cargo average is on spec, your customer experiences variability that disrupts their process. Many offtake agreements now include hatch-by-hatch penalty clauses for this reason.
• Stacker and reclaimer position data
• Belt weightometer readings
• Laboratory assay results
• Stockyard geometry and equipment specifications
Most sites already collect this data — it’s just not connected spatially. StockyardViz brings it together into a unified 3D model.
The platform binds your real-time data to the 3D model, so operators, planners, and management all see the same operational picture.
This accelerates shared understanding and impact analysis — planning teams, operations, and management can all work from the same spatial interface without needing to be physically present in the control room.
The underlying challenge is the same: understanding what’s inside your stockpiles and making better decisions based on spatial reality.
From there, a typical implementation takes 8-12 weeks from kickoff to operational use, including site modelling, data integration, calibration, and training.